While way-finding,

Is human a Genius or a Lazybone?

Introduction

Navigation in the information network is an essential part of our everyday lives. It is significant to understand how humans build the link between two words, in order to design user-friendly interactive system.
It is a general idea that: different from how a computer process the task, humans will not always choose the shortest path to reach destination. And at the first glance, one might consider that different people will link two words in various way according to their prior knowledge.
However, here we want to investigate whether there is a common and general pattern in human’s formation of the word navigating. During the way-finding procedure, do human generate fantastic ideas to finish the word to word linking? Or though people finish the task in various path, there still exist a potential pattern in human’s mind to link two topic words.
We carry out our analysis by using the dataset collecting through the human-computation game Wikispeedia.
Our main approach consists in analyzing the finished path during the game and delving into the contents in HTML pages which people scan in their navigation actions. The analysis part could be divided into two primary sections: research on the potential pattern included in the finished path (internal factor) and study whether the contents in HTML pages will influence people’s way-finding between the source and destination (external factor).

Research Question A

Is there any specific pattern change in articles’ topic component, during the clicking process? For example, when navigating from ‘Zebra’ to ‘French Revolution’, there is a hypothesis that the elements of animals may decrease, and the elements of history or politics would increase through the path. Does the ‘Zebra & French Revolution‘ hypothesis mentioned above or similar phenomenon hold?

Research Question B

Are there any external factors that influence people’s choice of clicking, i.e. contents on HTML pages?
1. Do people tend to click links in an easy sentence or a professional sentence?
2. Do people tend to click links that show up in the first a few lines of the article or links that have concentrated distribution in the webpage?


Let's take an overview of our datasets

The dataset is collected through the human-computation game Wikispeedia containing human navigation paths on Wikipedia. When playing the game, users are given a source article and a target article. The goal is to navigate from the source to the target, by only clicking Wikipedia links. In this game, a condensed version of Wikipedia is used. This dataset includes 51318 finished paths, 24875 unfinished paths, shortest path distance possible, users’ ratings of given tasks, 119882 links, and 4604 articles with plain text, full HTML packages and corresponding categories. Below are some visualizations of basic statistics of the dataset.


Basic Analysis on the common pattern of navigation paths

What path do people like to follow? Which category of articles do people tend to select?

We begin our investigation by counting the basic statistical results from the dataset. We focus on the finished path and try to find whether there is an article selection tendency in people’s playing procedure. The section will be divided into two parts. In the first part, we will investigate which kind of article do people select in their first step. In the second part, we study on the finished path in details. We introduce the term path pair and carry out the statistical analysis on which path pair do people often choose.

Which kind of articles do people select in their first step?

In the dataset, each article has its own belonging category, and the category is in hierarchical form with the deepest depth reaches 3rd layer. For example, the word Albatross belongs to category “subject.Science.Biology.Birds”. For simplicity, we only use the second layer as their category in our analysis. Therefore, there are 15 article categories in total in the dataset. When it comes to the finished path, we remove the path with the length equals to 0 which means that the source and the destination words is the same or the destination word directly shows in the source article. In this situation, it is hard for us to distinguish whether the player finish the navigation tasks by lucky or not.
After the pre-processing above, we count all the category of the first article that people choose. The result is shown as below:

Besides counting the number of clicking on the first articles, we also include the number of articles in each category in the picture. We consider that the article number in one category will also influence people’s clicking behavior and the normalization is necessary. For example, the clicking on articles belongs to Science is 13672 times while the amount of articles in this category is also large (1122 articles). As a consequence, we calculate the ratio of each category and draw the statistical diagram again.

From the above results, we draw to the conclusion that people tend to select articles belong to category Countries and Geography in their first step. The ratio is far larger than the other categories. We speculate the reason is that people are more familiar with the Countries and Geography information of the target words. It is a general approach of getting closer to the destination via moving to articles that have similar geographic location and country information. Take the word “panda” for instance. When people are required to navigate to this target, people should first click to articles that include China or Asia elements. Hence, the Countries and Geography information could help people step closer to their target quickly which leads to the high ratio results of category Countries and Geography in the above diagram. And this is a possible linking pattern exist in the game.

Which path pair occurs the highest times in all paths?

Then, we count the number of path pair in the finished path. We will first give the definition of path pair. Assuming there is a finished path A->B->C->D, then the path pair of it is (A,B), (B,C) and (C,D). Considering that the last three path pairs will be influenced by the distribution of target word in all games significantly, we will remove the last three path pairs. The result is shown below:

From the above results, we find that the path pair (Brain, Computer_science), (Asteroid, Earth), (North_America, United_States), (Europe, United_Kingdom) and (United_States, North_America) are the top 5 path pairs that occur. Most of these five path pairs include the information of geography and countries. It seems that this result strengthened our conclusion in the first part of this section: People tends to use the geographic location and nationality to find the target words.
Then, take the path pair (North_America, United_States) for example. We would like to find in which source and target categories do people tend to generate this path pair. The outcome is as following:

From the result, we find that the path pair (North_America, United_States) always appear when the categories of the source and destination words are about science, geography and people. And people also click the United States in the North America article when the destination word belongs to IT and Technology. We consider that the selection of the article to click next is significantly impacted by the category of source and target words, however, when the category is not related to the path pair, people also click the article United States. It might could be explained by the contents that people scan during the game.
In the later analysis, we will delve deeper into the influence of HTML page towards to the frequency of path pair. In more detail, we will discuss whether the HTML contents lead to the high occurrence frequency of path pair (North_America, United_States). Does the readability lead to the result above?

analyze on topics


LDA Model

In order to gain a deeper understanding of the paths that players took through our game, we employed a powerful tool called latent dirichlet allocation (LDA). Although we have the category of each article in the dataset, however, each article only belongs to one or two categories sharply. We use LDA model for the reason that this probabilistic model allows us to identify the distribution of topics present in a large corpus of text, and we trained it on the entire Wikispeedia plain text corpus. This allowed us to see how the topics that users were interested in changed over the course of the game, and how they moved from one topic to another.
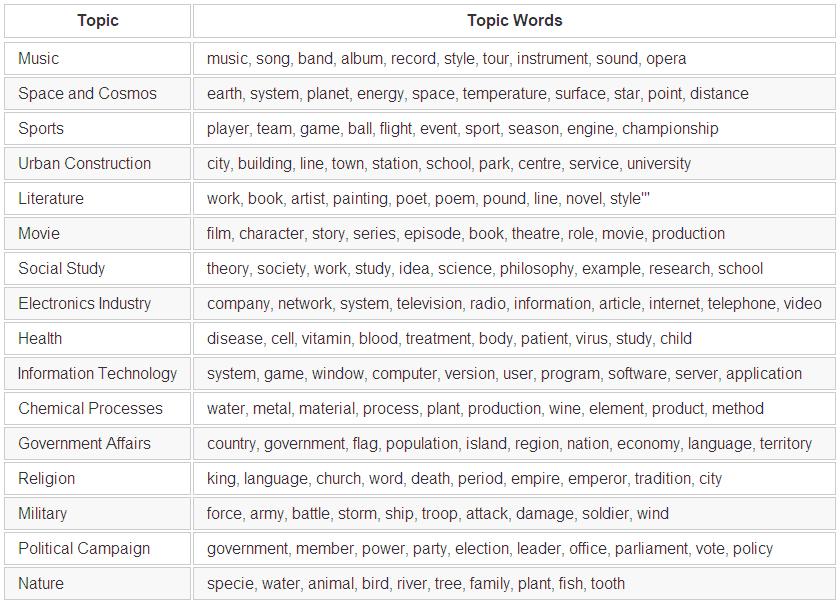
After carefully fine-tuning the parameters, we determined that there were 16 distinct topics present in our LDA model, which is quite close to the number of topics assigned in Wikispeedia. The topics and corresponding topic words we select is shown in the Table. And topics are represented in the Intertopic Distance Map.

However, it's important to note that while Wikispeedia primarily focuses on categorizing entities, the topic distribution generated by our LDA model is more concerned with the actual content of the passages.
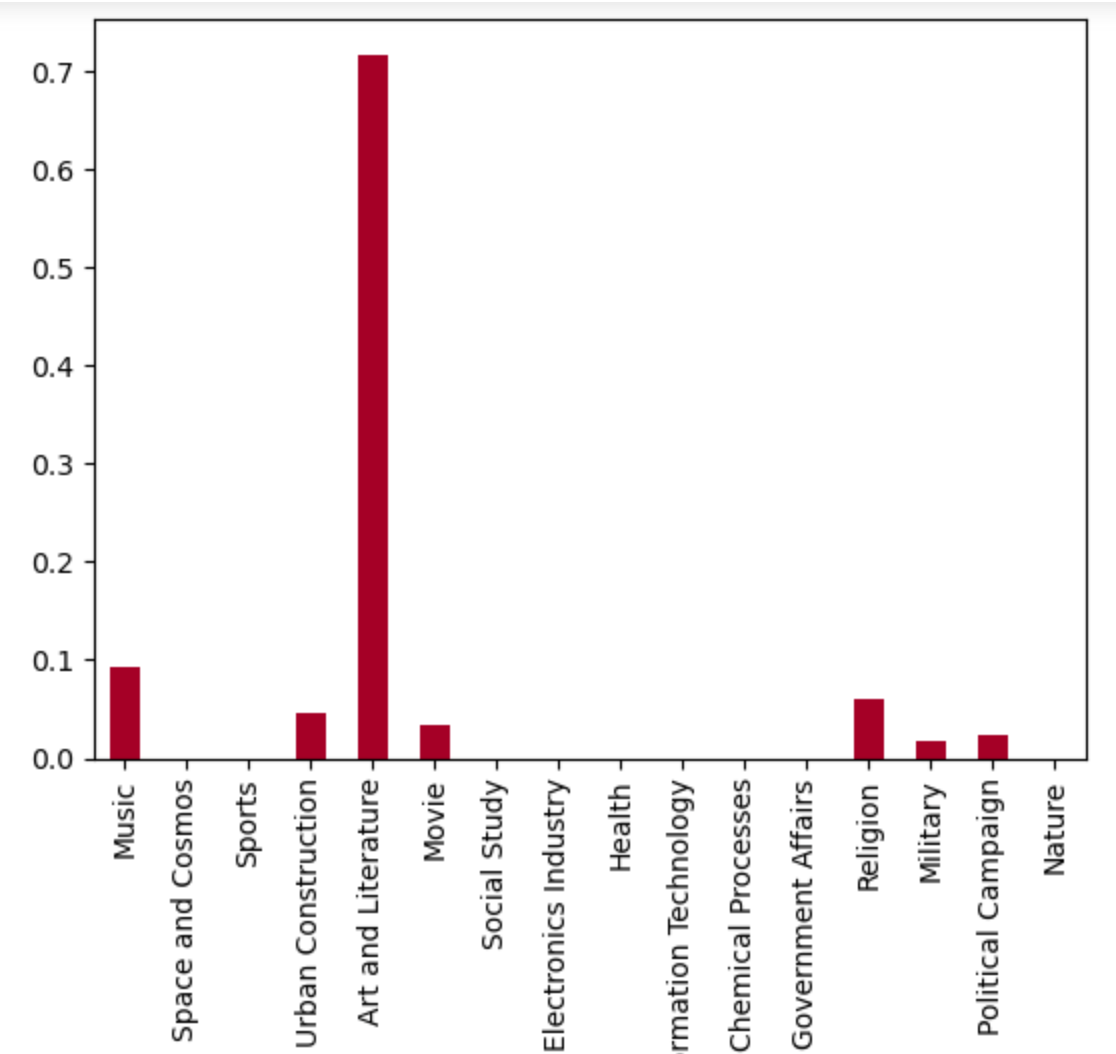
To give you an idea of how this works in practice, let’s consider the example of Édouard Manet, the famous French painter. In Wikispeedia, Manet would be classified under the category of "People.Artists". However, this classification tells us very little about the specific content of Manet's page or the themes and topics that it covers.
Our LDA model allowed us to delve into the actual content of Manet's page, where the most significant topic was "Art and literature." This suggests that Manet's page is heavily focused on topics related to the world of art and literature, such as his paintings, artistic style, and the cultural context in which he worked.

Is there a clear topic transition during human’s linking procedure?

Having obtained an understanding of the topic distribution of each article through the LDA model, we are now able to examine the changes in topics within the paths that users take during the game.
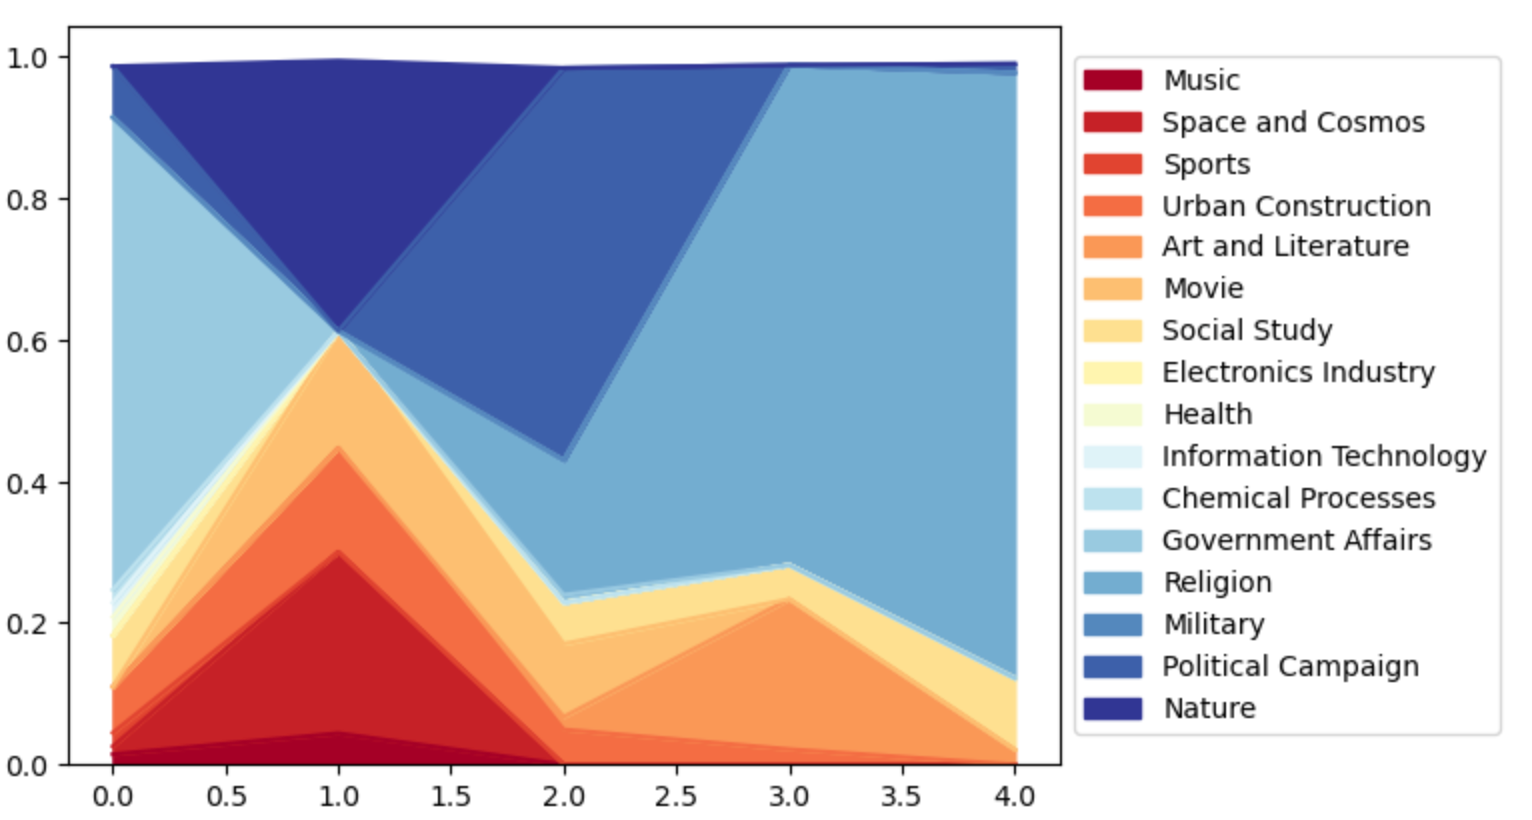
For instance, one user who was assigned the path from "People's Republic of China" to "Jesus" took the following route: "People's Republic of China" - "Giant's Causeway" - "Martin Luther King, Jr." - "Last Supper" - "Jesus." This path showed a clear trend of the proportion of religion-related topics increasing as the user progressed towards the destination. We draw the topic transition diagram and display it below. The y axis is the topic probability distribution of article that player choose. And the x axis is the article that player choose during the game.
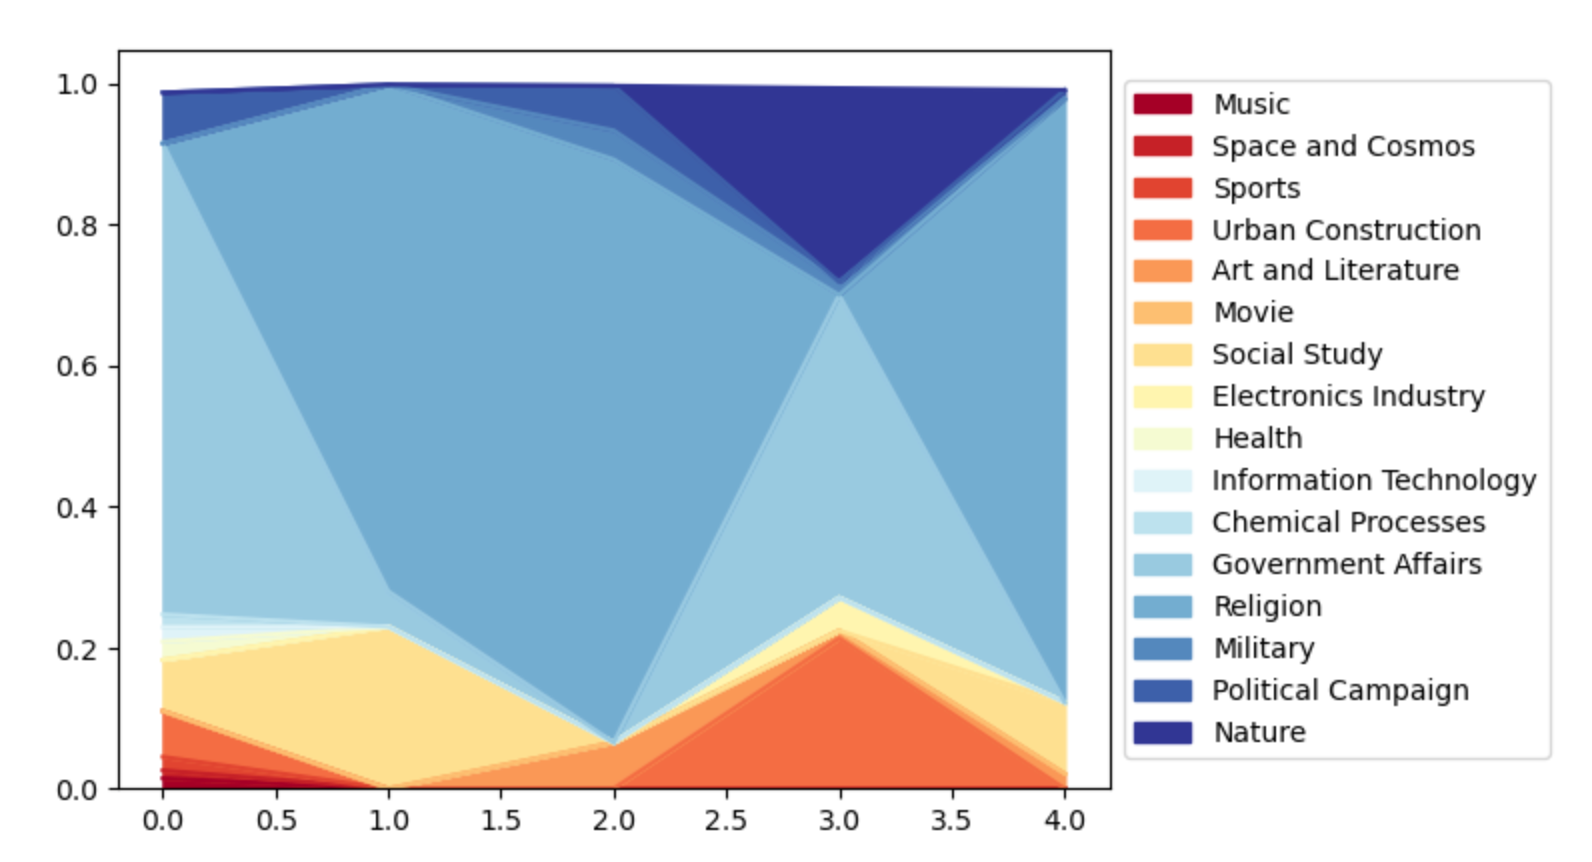
We also select another finished path in the dataset. The user with the same start and destination took a different path: "People's Republic of China" - "Latin" - "Romulus Augustus" - "Christmas Island" - "Jesus." While this path also showed a similar trend of increasing religion-related topics, it took the user several more steps to reach the final destination.
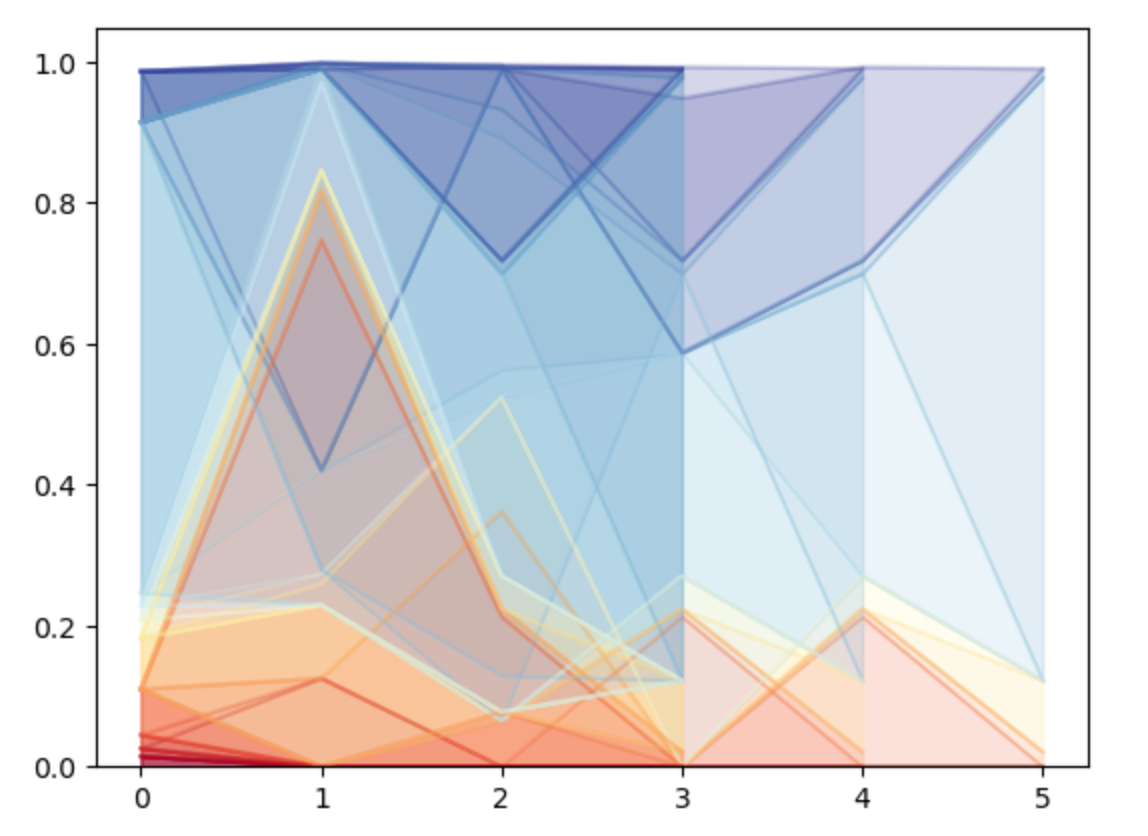
Let’s take a look at all the paths from PRC to Jesus. It seems that we often see that the transition between the topics of "government affairs" and "religion" goes through intermediate topics such as "nature" or "urban construction." However, this can vary significantly between different users.
From the above analysis, we draw to the conclusion that thought we might expect the distribution of topics within the links that users click on to follow a linear or summable path, this is not always the case in practice. Instead, the overall trend of topic distribution within the paths that users choose tends to evolve towards the target, but due to differences in prior knowledge and the unknown nature of the chosen links, it is difficult to develop a comprehensive method for fully capturing the users' thought processes.

Analyze on HTML files

Does the readability of the contents on webpage influence people’s linking task?

In this section, we will concentrate on the HTML pages. We research on whether the readability of sentences including links influence people’s clicking behavior. The readability evaluation methods we use are as following:
1. Flesch reading-ease
2. Flesch-Kincaid Grade Level
3. Dale Chall Readability
4. Automated Readability Index (ARI)
5. Coleman Liau Index
6. Gunning Fog
We use the plaintext in our dataset as example to test those six evaluation approaches, the readability score for these six methods is shown in the following diagram:

From the above results, we find that the score of Flesch reading-ease is different from the other scores. The reason is that it uses a distinct scoring formula comparing with others. If we check the converted grade level from the score, the grade levels are almost the same. Therefore, in the later analysis, we will only use the Flesch reading-ease to calculate the readability of contents in the webpage. In the Flesch reading-ease, a higher score means it is easier for human to understand.

What is the readability of sentences which include the high frequency path pair?

We continue to delve into the reason why several path pairs occur plenty of times in all games. In more detail, if the path pair is (Asteroid, Earth), we will calculate the readability score for all sentences including the link “Earth” in the article “Asteroid”. We choose the top5, top5-10, bottom 5-10 and bottom 5 path pair appearing in all finished path and calculate the readability of them. For conciseness, we directly call this value the readability of the path pair. The result is shown as:

From the above analysis, we find that the readability score of high frequency path pair is larger than the lower frequency path pair. It seems that people tend to click the link comes from a much easier understanding sentence which is same to our intuition. With this preliminary conclusion, we delve into the readability of all links appeared in the HTML pages.

What is the readability distribution over sentences which include different clicking frequency of links?

Again, for simplicity, we call the readability of sentences including a specific link as the readability of this link.
In this part, we count on the frequency of all links that people could click in the webpages. And then we calculate the readability of those links from the corresponding plaintexts. Then, we will get a readability distribution over all links. We divide all links according to its clicking times into 10 intervals. Considering the larger amount of links and articles in the whole dataset, we carry out the readability calculation through sampling and repeat. In each procedure, we sample 5% articles and extract all links in them. Afterwards, we count the clicking number of those links and compute the readability value. The procedure has been repeated 10 times in total. The results diagram is:

In the above plot, the x-axis is the frequency interval of the clicking links. [0, 0.1) means the clicking time of those links is between 0 to 10% of the maximum clicking frequency. From the results, we discover that for those links which have a higher clicking numbers, they possess a higher readability score, which indicates that the sentences including those links are much easier for human to understand. The readability truly has an impact on people’s clicking behavior.
We consider that there are two possible reasons to explain the phenomenon.
The first one is that people do not simply skip all contents in the HTML page and only focus on the labeled links in the webpage. The fact is that players still scan the text on the page and then select their next link to click. For those links which have a lower readability score, in other words for those paragraphs and sentences which are more difficult to figure out, people have to pay more energy and time to read it and understand the content. As a consequence, during the game playing, people are reluctant to read those sentences with lower readability score. They prefer to only concentrate on sentences that are comfortable to read. And this explanation could lead to the results in previous diagram.
The second reason is about the position of the link. As we know, every Wikipedia page follows a general structure. For instance, at the beginning, there is an abstract of whole contents on the webpage. In the next several sections, Wikipedia will introduce relevant information one by one in details according to the sequence defined in Contents. Therefore, we put forward a hypothesis that people tend to only read the contents at the front of the page, for instance, the abstract of the whole HTML page. And we have also calculated the readability of abstract part and the detailed information introduction after the abstract. The readability score of abstracts is averagely higher than the other parts since it does not include plenty of professional terms and explanation.
As a consequence, we will continue to study on the question whether the position of links influence people’s clicking during the game.

Does the position of the links on webpage influence people’s clicking choice?

We will continue our research on the position of links. Put yourself in the players’ shoes, when you do the searching, would you read the articles carefully and thoroughly from the first line to the last line, or scan the article quickly and get the key point as fast as you can? It might be natural to do it in the latter way. If so, in the Wikispeedia game, people may have a tendency to click the links that shown earlier in an article. Is it really the case? In this section, we are going to investigate whether link position plays a role when people do the navigation.

What is the average position over all links in the HTML page?

In order to find the relationship of link position and click frequency. Let’s find the average position of the links first.
It’s important to define the link position. We decide to use the word index divided by the article length as the representative of link position. For example, if a link is the 20th word in a 200-word-article, its position is defined as 20/200 equals to 0.1. Therefore, the range of link position is (0,1]. Through this method, we get rid of the various length of HTML pages.
Then, we iterate through all the links in the HTML files and calculate the average link position. It turns out that the average link position is 0.4554 and the median is 0.4296. It shows that the links are not strictly, but almost uniformly distributed from beginning to end.

What is the average position of higher clicking frequency links in the HTML page?

After getting a glimpse of the whole links, how about the links that are clicked most in each article? For each article, we find the link that the users clicked the most and calculate the average position of it. The average value turns out to be 0.3321 and shows a shift from the average value of all links. It seems that the most popular links shown earlier in the articles.

Let's dig deeper in the next subsection.


What is the distribution of position over Top n% clicked links in HTML page?

To check the distribution of most clicked links’ position, we draw a bar chart as shown. The darkest bar shows the distribution (in percentage) of top 10% clicked links’ position in five intervals. The middle is the top 50% and the lightest bar shows the distribution over all links.
The bar chart tells us a lot of information. First, position 0.2 to 0.4 has the most links among all the intervals. We may infer that: In an article, after an introduction, this interval is usually the most divergent or connective to other articles (generally, this part is close to the abstract section in Wikipedia). Second, when comparing the top 10%, 50% and 100% top clicked links, top 10% and 50% have larger distribution in position 0 to 0.2 and 0.2 to 0.4, while for the rest of the position intervals has smaller distribution. What’s more, in position 0.2 to 0.4, the top clicked links show a significant increasement as the popularity grows.
herefore, we draw to the conclusion that people do have a tendency to the link position in the webpages when doing the navigation. People tend to click on links that occur earlier in articles (most from relative positive 0.2 to 0.4), for instance in the abstract part of the Wikipedia. The result goes along with our intuition. During the game playing, people do not have much time to scan the whole HTML contents. They instead focus on the first several lines of the webpage and read the corresponding contents to decide the next clicking article. The outcome in position analysis also strengthens the conclusion in the readability section. At the beginning of the Wikipedia, there do not include plenty of professional terms or equations, and when people prefer to select links in this section, the readability score of those links will then become larger as readability analysis shows.

Conclusion

From the above analysis, we could answer our initial title question preliminarily. During the word navigation, human is influenced by various general clicking patterns. We draw to the conclusion that people always use the geographical and national information to help them get closer to the target word. Players also tend to skip or look carelessly on sentences which are difficult to figure out. As the consequence, links in specialized or professional knowledge paragraph will not be taken into account during the navigation procedure. Besides, people are always attracted by links which lie at the front of HTML page and reluctant to scan the lower half of the webpage. All those internal and external factors make the path finishing by human a bit inflexible and seems stereotypical. However, human still remains their unparalleled creativity while finding the target word from the source. In LDA analysis, though different people may possess the similar topic transition in the article selection path in parts of tasks, nevertheless, given the source and destination word, it is still impossible to predict on the topic variation between source and target. Distinct people remain their own unique ideas toward the connection of two words, even when their linking tasks are same. Those fantastic thoughts make everyone separate from others.

OUR AMAZING TEAM

Haochen Su

Linying Yao

Ruihang Jiang

Weier Liu